Gold Crashed 9.4%. The Forensic Data Says Buy
Zero manipulation detected across six major miners. One blue-chip trade offers 40-75% upside

Executive Summary
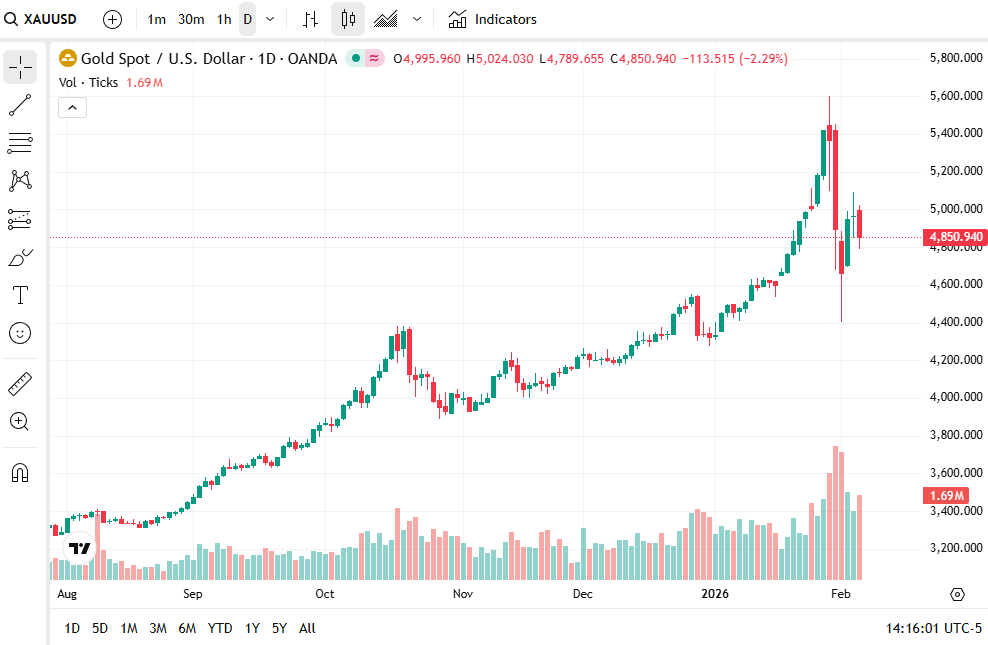
The precious metals sector enters February 2026 at a critical inflection point. After parabolic gains, gold surged 65% in 2025 to reach $5,595/oz before a 9.4% single-day crash (the largest since 1983), while silver spiked 145% to $121/oz before collapsing 30% in one day, the correction has cleared excessive positioning, but the fundamental underpinnings remain structurally intact.
Current Market Levels: Gold ~$4,850-4,950/oz; Silver ~$75-87/oz
Key Findings
Bullish Structural Drivers:
· Central banks accumulated ~863 tonnes in 2025 (fourth consecutive year above 750 tonnes)
· Silver faces its 5th consecutive supply deficit with structural imbalances intensifying
· De-dollarization through BRICS initiatives (local currency trade now 85-90% of settlements) creates price-insensitive demand
· Real yields declining from 2%+ to ~1.75%, removing key headwind for precious metals
· Fed is now pricing 1-2 rate cuts for 2026, supporting gold on lower real rates
Critical Red Flags Identified:
1. Barrick Gold: Mali dispute resolved December 2025 ($430M settlement after 3 tonnes seized), but CEO transition creates execution uncertainty; Reko Diq project carries high Pakistan jurisdiction risk
2. Kinross Gold: Tasiast mine in Mauritania represents ~30% of production but carries significant political risk; history of government renegotiations and work permit disputes
3. Franco-Nevada: $5 billion Cobre Panama arbitration pending (hearing October 2026); mine suspended since November 2023
4. Market Positioning: Extreme overbought conditions pre-crash (GDXJ 50.4% above 200-DMA); CME margin hikes triggered forced liquidations
5. Silver Physical Market: Deepest backwardation since 1980 signals structural scarcity; lease rates spiked to 39%
Forensic Verdict
No material earnings manipulation detected across major miners analyzed. Beneish M-Scores remain well below fraud-risk thresholds, and all major producers exhibit Altman Z-Scores comfortably in the “safe zone.” The sector bifurcates into two tiers:
· Tier 1 (Blue-Chip): Strong balance sheets, clean accounting, sustainable margins (Agnico Eagle, Wheaton, Franco-Nevada)
· Tier 2 (Speculative): Dilution cycles, high burn, exploration dependency (junior miners at distress-zone Z-scores)
Primary Trade Thesis
The correction presents accumulation opportunities in quality miners with low jurisdiction risk (Agnico Eagle, Wheaton) and physical metals ETFs (GLD, SLV). Options premium-selling strategies offer attractive risk-adjusted returns given 99th percentile implied volatility. Avoid chasing extended prices; await pullbacks to key technical supports.
Section 1: Macro-Geopolitical Risk Landscape
Interest Rate Expectations & Monetary Policy
After an aggressive hiking cycle (2022-2023), global central banks have pivoted toward neutral to dovish positioning entering 2026. The U.S. Federal Reserve delivered its first rate cut in late 2025, with policymakers signaling a couple more reductions likely in 2026. Futures markets are pricing in a Fed funds rate falling toward ~3% by end-2026. This outlook of peaking and declining real interest rates is bullish for gold: as yields decline, the opportunity cost of holding non-yielding assets like gold drops materially.
Critically, this dynamic persists even with Kevin Warsh’s nomination as Fed Chair (term begins May 15, 2026). While Warsh is viewed as potentially hawkish, the DOJ investigation into Chair Powell’s independence has paradoxically become gold-supportive, creating uncertainty that benefits safe-haven assets.
European Context: The ECB has ceased hiking, with inflation near 2% and growth tepid. ECB is expected to hold or ease modestly going forward. Central bank balance sheets, after quantitative tightening, are stabilizing or expanding again in technical operations to maintain liquidity.
Key Takeaway: A global plateauing of rates is removing a major headwind for precious metals. Wells Fargo and JPMorgan explicitly cite the prospect of lower short-term rates as justifying 2026 gold price targets of $6,100-$6,300/oz.
Inflation Trends & Currency Dynamics
Inflation has cooled from the red-hot 2022-23 levels but remains slightly elevated (3-4% across advanced economies versus 2% targets) and uneven regionally. Importantly, inflation expectations have not fully anchored at low levels. Central banks appear inclined to tolerate above-target inflation to avoid economic damage, effectively erring on the side of financial stability over strict hawkishness. This environment is constructive for gold as an inflation hedge.
Currency dynamics amplify the case: The U.S. dollar index (DXY) sits near four-year lows at ~97.5, down 9% year-over-year. Multiple bank forecasts target further weakness: Morgan Stanley projects DXY at 94 by mid-2026; MUFG expects an additional 5% decline. Gold’s 2025 rally benefited from approximately 10 percentage points of return contribution via dollar weakness alone. A vulnerable or weakening dollar removes another cap on gold/silver upside.
Broadening Gains: Gold’s 2025 rally has been broad-based in currency terms. In late 2025, gold hit all-time highs not just in USD but in euros, yen, sterling, and CNY, underscoring a genuine global bid for the metal independent of currency translation effects.
Geopolitical Instability & Safe-Haven Demand
Geopolitics remain a primary risk premium driver. The ongoing Ukraine war, elevated Middle East tensions, and political uncertainty globally keep investors seeking portfolio insurance. Throughout 2025, each bout of escalated conflict coincided with gold price upticks. Analysts note that risk premia are at multi-decade highs due to sustained global instability.
Even if current crises don’t worsen, their mere persistence contributes to a background bid for gold/silver as portfolio insurance. Conversely, any unexpected resolutions (peace deals, trade normalizations) could reduce that risk premium, a potential negative catalyst.
Policy Uncertainty: Leadership transitions and unexpected policy shifts can trigger sharp, disproportionate reactions. The sharp sell-off in gold following a Fed leadership rumor earlier in 2026 demonstrates how quickly sentiment can reverse on political news, highlighting the importance of monitoring policy calendars.
Section 7: Specific Trade Ideas & Execution Framework
Directional Positions
LONG: Agnico Eagle (AEM), Quality Conviction Position
· Rationale: Best-in-class jurisdiction (70% Canada), lowest AISC, record FCF, net cash balance sheet
· Entry: $115-125 (on pullback from $140+ highs)
· Target: $175 (6-month), $200 (12-month)
· Stop Loss: $95 (-17% from mid-entry)
· Position Size: 3-5% of portfolio (core holding)
· Risk/Reward: 1:3.5
· Catalyst: Continued FCF generation; Odyssey project updates; gold above $4,500
LONG: Kinross Gold (KGC), High-Beta Value Play
· Rationale: Transformed balance sheet; highest FCF yield; Great Bear optionality; discounted valuation
· Entry: $12-14 (await Mauritania risk clarity)
· Target: $22 (6-month), $28 (12-month)
· Stop Loss: $9.50 (-24% from mid-entry)
· Position Size: 2-3% (elevated risk due to Tasiast exposure)
· Risk/Reward: 1:4
· Catalyst: Great Bear permitting progress; gold rally continuation; Tasiast stability
LONG: SLV (iShares Silver Trust), Physical Silver Exposure
· Rationale: Structural supply deficit; industrial demand surge (solar, EV); backwardation signals scarcity
· Entry: $65-75 (current consolidation zone)
· Target: $95 (6-month), $120 (12-month new high test)
· Stop Loss: $52 (-25% from mid-entry)
· Position Size: 3-5%
· Risk/Reward: 1:3.2
· Catalyst: Solar installation data; China export restrictions; silver lease rate spikes
Options Strategies
Strategy 1: GLD Cash-Secured Put Strategy, Premium Collection
· Structure: Sell GLD April 2026 $380 puts @ $12.00
· Max Gain: $1,200 per contract (3.2% yield in 75 days)
· Breakeven: $368 (18% below current)
· Risk: Assignment at $368; effective entry with $46/share profit
· Rationale: IV at 99th percentile creates attractive premium; gold unlikely to breach $3,800 support
· Size: 5-10 contracts per $100K capital
Strategy 2: SLV Bull Call Spread, Defined Risk Upside
· Structure: Buy SLV June 2026 $80 call, Sell SLV June 2026 $100 call
· Net Debit: ~$6.50 per spread
· Max Gain: $13.50 (208% return if silver above $100 at expiry)
· Max Loss: $6.50 (premium paid)
· Breakeven: $86.50
· Rationale: Captures silver upside potential with capped risk