
Palantir FY2024 Forensic Financial Analysis
Forensic Accounting Review: Palantir’s Transition to Profitability Amidst Dilution Pressures

Executive Summary
Strong Revenue Growth but Healthy Composition: Palantir’s revenue grew ~29% in 2024 to $2.87 billion, driven by both government (28% YoY) and commercial (29% YoY) segments. Growth was largely from expanded use by existing customers (e.g. +$280.7M from existing government clients) rather than one-time gimmicks. Notably, revenue from prior “strategic” SPAC-related contracts actually decreased by $35 million, indicating core organic growth. This reduces concern of any suspicious revenue spike from non-recurring sources.
High Gross Margins, Turning Profitable: Palantir maintained ~80% gross margins and achieved positive operating and net income in 2024 (GAAP operating income $310.4M; net income $462.2M to shareholders) after prior losses. Operating cash flow ($1.15B) far exceeded net income, thanks to large non-cash expenses, suggesting earnings quality is high (cash is not lagging reported earnings). No evidence of aggressive expense capitalization was found – R&D is expensed (17.7% of revenue) and capex is minimal (only $12.6M in 2024).
Earnings Manipulation Risk Appears Low: The Beneish M-Score for 2024 is approximately -2.60, well below the red-flag threshold of -2.22. Key indicators like receivables grew proportionally with sales (DSRI 1.22) and gross margins held steady (GMI ~1.00), while depreciation was not slowed (DEPI <1) and accruals were negative (large non-cash expenses) – all supportive of low manipulation risk. Similarly, Palantir’s Altman Z-Score is off the charts high (driven by large cash, no debt, and a ~$191B market cap), far above the “safe” zone threshold of 3.0, indicating no bankruptcy risk. A Piotroski F-Score of 5 (out of 9) reflects middling financial strength: profitability and liquidity improved (positive net income & cash flow, higher current ratio), but no improvement in leverage (no debt to reduce) and continued share issuance weighed on the score.
Red Flags: The most prominent concern is shareholder dilution from stock-based compensation (SBC). Palantir issued ~139 million net new shares in 2024 (+6% YoY) and has increased its share count ~15% since 2021. SBC expense jumped to $693M in 2024 (24% of revenue) from $476M in 2023. This dilution could threaten future per-share earnings despite improving business fundamentals. Another flag is a complex revenue recognition arrangement: Palantir delivers software licenses bundled with ongoing services, which required significant auditor scrutiny as a critical audit matter. While no misstatements were found, the complexity means revenue timing relies on management’s judgments (a potential risk area). Additionally, related-party transactions merit note: Palantir paid $7.7M in 2024 for use of CEO Alex Karp’s personal aircraft – an unusual governance red flag (although not material to financial results). Lastly, accounts receivable rose faster than revenue (A/R up 58% vs revenue 29%), pushing days sales outstanding higher. This could indicate more lenient payment terms or late-quarter sales, warranting monitoring (though it may also reflect larger government contracts with slower billing cycles).
Peer Benchmarking Highlights: Compared to analytics and software peers, Palantir shows superior profitability but higher dilution. Its 80% gross margin is on par with or above peers, and its +11% GAAP operating margin in 2024 stands out versus Snowflake’s -40% and Alteryx’s -17% (Splunk and SAP were +5.7% and +13.6% respectively). Palantir’s R&D spending (18% of revenue) is sizable, though Snowflake and Alteryx invest similarly (~20%+), whereas Cognizant’s is negligible. Stock compensation, however, is where Palantir is an outlier: cumulative SBC over 2021–2024 exceeds $2.1B, significantly diluting shareholders. Peers like Snowflake also use heavy SBC (e.g. $1.17B in 2023, 42% of revenue), but Palantir’s dilution is exacerbated by a longer history of private share grants pre-IPO and an initially low share price. On productivity, Palantir generates $728k revenue per employee, far above a services-heavy firm like Cognizant ($55k) and higher than product peers (Snowflake ~$460k, Splunk ~$530k) – reflecting Palantir’s high-value contracts and leaner staffing.
Overall, Palantir’s 2024 financials show improving health (growing cash flows, no debt, profitable operations) with no glaring signs of earnings manipulation or liquidity stress. The primary risks lie in share dilution and the quality of revenue (long-term government contracts with slow collection and complex accounting). Investors should monitor management’s use of SBC and any changes in revenue policy or customer concentration that could distort results. Below we dive into the detailed findings, red flags, and model outputs, followed by a side-by-side peer comparison and an appendix of supporting data.
Income Statement & Cash Flow Analysis
Palantir’s income statement for 2024 reveals robust growth and a swing to profitability. Revenues reached $2.8655 billion, up 29% year-over-year. Notably, growth was balanced across its two segments: Government revenue grew 28% to $1.57B, and Commercial grew 29% to $1.30B. The 2024 growth rate marked a re-acceleration from 2023 (~17% YoY growth, from $1.905B to $2.225B) and appears driven by organic expansion rather than new product lines or acquisitions. Management attributes the increase to greater uptake by existing customers (e.g. $280.7M of the gov’t increase came from clients as of 2023) and broad-based new customer additions, especially in U.S. commercial (which rose 54% to $702M). This suggests the revenue quality is high – current customers are finding more use cases, indicating satisfaction and engagement, rather than revenue being propped up by one-off fees or undisclosed related-party sales. A potential concern could be the decline in “Strategic Commercial Contracts” revenue by $35M. These were deals Palantir made by investing in startups (SPACs) that then became customers. The decline implies Palantir is now relying less on those arrangements for sales (which is arguably positive for quality of revenue). In sum, there are no obvious red flags in revenue growth – it is high but explained by operational metrics (customer counts, usage) rather than accounting maneuvers.
Gross profit in 2024 was $2.30B (80% margin), only slightly down from 81% in 2023 – essentially stable gross margins. This indicates Palantir did not juice profits via under-reporting cost of sales or aggressive capitalization of costs. In fact, cost of revenue grew 31%, a bit above revenue growth, due to increases in subcontractor and cloud hosting costs (variable with customer usage) and higher stock comp in cost of sales. The gross margin dip to 80% (from 81%) is minor and not suspicious – it reflects real business mix (e.g. more cloud deployments). Palantir’s accounting for software deployment costs appears consistent. There’s no indication they deferred costs to improve margins; if anything, they expensed aggressively (e.g. expensing all R&D as incurred and even expensing stock-based compensation in COGS for deployment personnel).
Operating expenses grew 19% in 2024, slower than revenue, which improved operating leverage. Notably, Sales & Marketing (S&M) rose 19%, R&D 26%, and G&A 13%. The fact that S&M grew slower than revenue (19% vs 29%) could be a yellow flag – sometimes companies might cut marketing to boost short-term earnings. However, in Palantir’s case, S&M was still a hefty 31% of revenue, and the slower growth likely reflects efficiency gains and shifting focus to large strategic customers rather than any concerning underspending. R&D increasing 26% (to $508M) shows Palantir continues to invest heavily (R&D ratio ~18% of sales). There is no evidence of expense shifting (like classifying operating costs as capital investments). In fact, Palantir’s capex was only $12.6M in 2024, and it has no line item for capitalized software or goodwill on the balance sheet. This indicates they expense nearly all development costs. The operating income came in at $310.4M (10.8% margin), a significant improvement from $120M in 2023 and a $(161)M loss in 2022. This upward inflection in profitability aligns with management’s narrative of scaling up profitability as top-line grows, rather than any accounting gimmick.
On the balance sheet and cash flows, a few items stand out. Accounts receivable (A/R) jumped to $575M from $365M, an increase of $210M (58%) which outpaced revenue growth. As a result, Days Sales Outstanding (DSO) rose (DSRI index 1.22 in the Beneish analysis). This could be a flag that Palantir’s customers (especially government clients) take longer to pay or that Palantir booked many deals late in Q4 2024, swelling year-end receivables. It’s a point to monitor – a continued trend could pressure cash flow. However, given Palantir’s government-heavy business, slower collections are not unusual (governments often pay slowly). There’s no sign this A/R growth is due to channel stuffing or fake sales – just possibly timing. Deferred revenue (billings collected in advance) rose modestly to $299.5M total (current + noncurrent) from $274.9M, a $24.6M increase, which roughly matches the pattern of revenue growth. Customer deposits (cash received for contracts not yet meeting revenue recognition criteria) also increased by ~$55M. These trends suggest Palantir continues to sign large, multi-year deals with upfront payments (common in gov’t projects). Nothing abnormal is noted here; in fact, liabilities grew in proportion to the business.
Crucially, Palantir has no debt – as of Dec 31, 2024 it carried $0 in short or long-term borrowings. It ended the year with a hefty $2.1B in cash and $3.13B in marketable securities on hand. The company even initiated a modest share buyback, repurchasing 2.1 million shares for $64.2M in 2024. That’s a tiny 0.1% of shares, but it signals excess cash. The absence of debt and positive cash generation means no liquidity red flags – Palantir is not at risk of financial distress. The Altman Z-Score, which incorporates working capital, retained earnings, EBIT, market value, and revenue, comes out extremely high (far above the safe-zone threshold of 3.0. This is mainly because Palantir’s market capitalization ($190B at 2024 year-end) dwarfs its liabilities, and its working capital is very strong ($4.94B). In short, bankruptcy risk is practically nil.
Cash flow from operations (CFO) was $1.154B in 2024, up 62% from $712M in 2023. Operating cash flow has consistently exceeded net income in recent years – in 2024, CFO was about 2.5x net income. This largely reflects Palantir’s heavy non-cash expenses (especially SBC of $692M and depreciation $31.6M). Forensic analysts often check if net income is higher than CFO (which can signal aggressive revenue or accrual accounting). Here it’s the opposite: cash flow is much higher than earnings, implying conservative or high-quality earnings. One driver is stock-based comp – which is expensed on the income statement but doesn’t consume cash (CFO adds back $691.6M). Another is deferred revenue and customer deposits providing cash upfront (together up ~$77M). There’s also a notable add-back of unrealized investment losses: $19.3M in 2024, on top of prior years’ $272M in 2022, related to Palantir’s strategic investments (SPAC-related marketable securities). These are non-cash charges that depressed net income but don’t hurt cash – again conservative accounting. We do not see discrepancies that suggest earnings manipulation. If anything, Palantir’s net income is understated relative to cash generation because of the large equity compensation expense. Total accruals to assets (TATA) in Beneish terms was about -0.11, a negative number (which actually reduces the M-Score, meaning lower fraud risk).
In summary, Palantir’s P&L and cash flows show improving performance with no evident signs of financial engineering. Revenue growth is real and backed by cash (CFO/Revenue ~40%). Expenses are being managed but not unnaturally slashed. The main thing to watch is accounts receivable (to ensure revenue isn’t building up without cash collection). Also, as profitability improves, one might expect stock comp growth to moderate – but in 2024 it jumped (we’ll explore SBC in depth in a later section). Overall, though, nothing in the income statement or cash flow statement screams “red flag.”
Footnotes & Accounting Policy Review
A deep dive into Palantir’s 10-K footnotes and management discussion reveals a few areas of interest: revenue recognition, related-party dealings, and risk disclosures. Forensic scrutiny here aims to catch any subtle shifts or opaque practices that could mislead.
Revenue Recognition: Palantir’s revenue comes from software license subscriptions (some on-premises) bundled with ongoing support/services, as well as cloud hosting and consulting. The 2024 10-K did not announce any change in revenue policy, but the audit report flags revenue recognition as a Critical Audit Matter due to the “significant judgment” in determining performance obligations. Palantir often sells its Gotham or Foundry platform along with multi-year O&M (operations and maintenance) services as a single package. The company concluded the software license and O&M are “not distinct” and thus are accounted for together as one performance obligation. This means Palantir recognizes that revenue ratably over time (rather than a big upfront license chunk). The auditors specifically evaluated whether any “non-standard terms” in contracts could require treating elements separately. The fact that EY was comfortable and issued an unqualified opinion suggests Palantir is adhering to its stated policy consistently. Importantly, Palantir adopted a new segment reporting standard in 2024 (ASU 2023-07), but it still reports as a single operating segment (with supplemental geographic and customer-type breakdowns). No revenue was hidden off-books or shuffled between segments since none are defined – an investor just needs to note that government vs commercial splits are provided in the notes, but expenses aren’t allocated between them.
We should note a potential risk: Palantir sometimes begins work on projects before finalizing contracts (as acknowledged in Risk Factors). This means there could be situations of work-in-progress that isn’t yet contracted, which in theory could raise revenue cutoff issues. However, Palantir’s disclosure is cautious about this (warning that if a deal isn’t signed, they might not get paid). There’s no sign they booked revenue without a contract – it’s just a business practice to start early at times. Also, seasonality is noted: Q3 and Q4 tend to be heavy for deal closures due to customer fiscal cycles. That aligns with seeing a large Q4 receivables uptick. Forensic analysis should ensure that those big Q4 deals are legitimate – given the auditor’s comfort, we don’t see evidence otherwise, but it’s an area to watch (e.g. if DSO keeps climbing, one might question if some Q4 revenue was prematurely recognized).
Related-Party Transactions: The 10-K discloses one notable related-party item: CEO Alex Karp’s aircraft. Starting in 2024, Palantir paid $7.7 million for use of a private aircraft beneficially owned by Karp for his business (and personal) travel. This is essentially Palantir covering the costs of Karp’s jet usage. While this doesn’t impact the financial statements significantly (it’s a G&A expense), it raises a governance red flag. It suggests an unusually expensive perk and a potential conflict of interest (Palantir’s money indirectly going into an asset of the CEO). For forensic purposes, related-party deals can sometimes hide value extraction by insiders. In this case, it’s a disclosed expense, not some hidden revenue transaction, so the main risk is governance/optics (excess CEO benefits) rather than earnings manipulation. No other material related-party sales or loans were noted – Palantir’s customers and suppliers are mostly unrelated third parties (some early investors had customer relationships, but by 2024 no such deals were material enough to disclose).
Accounting Estimates & Policy Changes: We looked for any changes in accounting principles or questionable estimates. Palantir’s critical accounting estimates revolve around stock-based compensation valuation and the useful lives for software/hardware, and valuation of strategic investments. The stock comp valuation (using Black-Scholes for options, etc.) is detailed in the notes, but that’s standard, and the assumptions (expected volatility, etc.) seem reasonable for a company of its nature. There was no change in depreciation or amortization policy – if anything, Palantir depreciated assets slightly faster relative to remaining life (Beneish DEPI was 0.93, indicating no extension of asset lives). Asset quality improved as well – intangible assets and other off-balance-sheet items (like operating lease ROU assets) are minimal relative to total assets (only ~5.8% of assets were “other” non-current assets in 2024, down from 7.4% in 2023. This drop in the Asset Quality Index (AQI ~0.78) means Palantir did not pile up questionable long-term assets; if anything, its balance sheet became more liquid (cash and securities grew).
One area to watch was Palantir’s investments in marketable securities. In 2021, Palantir invested hundreds of millions in SPAC equities, which then dropped in value in 2022 (hence the $272M loss in “Other expense” that year). By 2024, those are largely written down. Palantir categorizes remaining holdings properly as available-for-sale securities, marking them to market through OCI (unrealized gains/losses) and impairing through earnings if needed. In 2024, there was a $3.0M net unrealized loss in OCI on these securities – trivial in context. This is transparent in the comprehensive income statement. So, no hidden losses there.
Risk Disclosures: Palantir’s risk factor section reads as one would expect for a government and commercial software vendor. A potential ambiguous disclosure is their note on “strategic investments” risk – earlier filings mentioned that Palantir’s investments in, and revenue from, early-stage companies could create volatility. By 2024, that risk is diminished (as evidenced by the decline of that revenue stream). Another risk factor worth highlighting is stock-based compensation and talent retention. Palantir notes that to hire and keep talent, they rely on equity grants – if the stock price falls or if they are perceived as too dilutive, it could harm their ability to hire (and thus the business) – this is mentioned in risk factors about attracting talent and potentially needing to increase cash compensation if equity comp is less attractive. They also mention that substantial future sales of stock (e.g. when lock-ups expire or when employees sell shares) could depress the share price – basically warning investors of dilution and supply of shares. This is a candid admission of the dilution risk inherent in their model. It’s not “ambiguous” per se – it’s quite explicit. If anything, management’s discussion of share repurchases in 2024 (authorizing $1B, with $935.8M still available at year-end) is an action to counter dilution, indicating they recognize the concern.
No off-balance sheet arrangements of concern were noted. Operating leases are on the balance sheet (per ASC 842, Palantir shows $200.7M of ROU lease assets and corresponding $239.2M of lease liabilities). Palantir doesn’t use any factoring, SPEs, or unusual financing. The undrawn $500M credit facility is disclosed but not used. Guarantee and indemnification commitments to customers (common in software contracts) are mentioned but not quantified as material. In short, the footnotes don’t reveal any hidden sources of risk. The auditor’s opinion on internal controls was clean (no material weaknesses), which means from a process standpoint, nothing systemic like revenue recognition errors or option backdating, etc., was found.
Auditor’s Opinion: Ernst & Young issued an unqualified (“clean”) audit opinion on the 2024 financials and an unqualified opinion on internal control effectiveness. There were no “emphasis of matter” paragraphs or going concern warnings. The only highlight was the critical audit matter on revenue we discussed. EY has been Palantir’s auditor since 2008, so they have long familiarity. Their report indicates they specifically tested contract terms and performance obligations carefully and found the disclosures appropriate. The lack of any restatement or adjustment in the filing suggests Palantir did not push any aggressive accounting that required correction. For example, if Palantir had tried to separate a software license to recognize revenue upfront, EY likely would have caught it. Instead, revenue is being recognized over time (likely conservatively). Also, EY’s clean bill on controls means they found no significant deficiency or weakness – important because companies growing fast can sometimes have control issues (e.g. revenue contract management or equity comp tracking). Palantir did not, which further lowers the risk of undiscovered misstatements.
In conclusion, our review of the footnotes and narrative finds no major accounting shifts or hidden bombshells. Palantir’s financial reporting appears transparent overall. The biggest noteworthy item – the CEO aircraft – is more of a governance concern than an accounting one. The complexity in revenue recognition is well-explained and audited. Investors should keep an eye on that complexity (as new products like the new AI Platform are sold, ensure revenue is recognized appropriately between license vs services). But as of 2024, Palantir’s accounting choices seem cautious (if anything delaying revenue via bundling obligations). This builds confidence in the quality of the reported earnings.
Forensic Risk Model Outputs
We applied three established forensic accounting models to Palantir’s financials: Beneish M-Score, Altman Z-Score, and Piotroski F-Score. These help quantify the risk of earnings manipulation, financial distress, and overall financial strength, respectively. Palantir’s scores, summarized below, do not indicate severe risk in 2024 – though they do highlight certain aspects to monitor.
Beneish M-Score (Earnings Manipulation Risk): Palantir’s calculated M-Score for FY2024 is approximately -2.60. This is below the key threshold of -2.22, which means the model does not flag Palantir as an earnings manipulator. In Beneish’s model (where higher, less negative scores imply higher risk of manipulation), Palantir’s score is comfortably in the safe zone. Let’s break down a few components:
DSRI (Days Sales Receivable Index) ≈ 1.22 – Receivables grew faster than sales (as discussed). While an increase can be a minor red flag (possibly signaling revenue puffed up by credit sales), a DSRI of 1.22 is not extreme. It likely reflects genuine timing issues with customer payments rather than fictitious revenue. If DSRI were >1.4, we’d worry more. Still, we note this is the one component leaning toward risk, so we’d want to see A/R growth normalize relative to revenue in 2025.
GMI (Gross Margin Index) ≈ 1.00 – Gross margin was essentially flat (slightly down). A GMI > 1 could indicate margin deterioration, which paradoxically might pressure management to manipulate earnings to mask the decline. Here, 1.00 indicates no meaningful change, so it neither particularly increases nor decreases risk. Palantir didn’t suddenly boost margins (which could signal under-reporting of expenses) nor see them collapse (which could create incentive to cook books).
AQI (Asset Quality Index) ≈ 0.78 – This <1 index means the proportion of “less reliable” assets (like intangibles or capitalized costs) on Palantir’s balance sheet dropped year-over-year. It suggests conservative accounting – they didn’t pile up deferred costs. A high AQI (>1) would mean rising intangibles that can hide expenses, but Palantir’s AQI is low, a good sign.
SGI (Sales Growth Index) ≈ 1.29 – Palantir’s strong growth is a double-edged sword in the model. High growth companies can face more pressure to meet lofty expectations, a risk factor for earnings management (Beneish found many manipulators had rapid growth). Palantir’s SGI is up there (29% growth). This doesn’t mean they are manipulating, only that high growth warrants vigilance. We check other metrics to see if anything inconsistent pops up due to growth – but as noted, cash flow kept pace, etc.
DEPI (Depreciation Index) ≈ 0.93 – Palantir did not slow its depreciation. In fact, depreciation relative to asset base was slightly higher in 2024 than 2023. A DEPI < 1 is a good sign (it means they aren’t extending asset lives to reduce dep exp). Some manipulators artificially lower depreciation to boost profits; Palantir clearly did not (their depreciation expense actually fell slightly as some assets fully depreciated).
SGAI (SG&A Index) ≈ 0.91 – Palantir’s SG&A as a % of sales decreased a bit (from 57% to 52%). Beneish gives a negative weight to SGAI because a large drop in relative SG&A might indicate cost-cutting to inflate earnings. Palantir’s reduction is moderate and likely due to scale efficiencies. The model would see a 0.91 SGAI as a mild risk factor (since management could, in theory, be underspending on marketing to show profit), but given Palantir still spent nearly $1.48B on S&M and G&A, there’s no evidence of under-investment. This could be normal scaling.
LVGI (Leverage Index) ≈ 1.00 – With no debt in either year, leverage is unchanged. There’s no new debt to hide or motivation to manipulate earnings to comply with debt covenants. This neutral factor neither adds nor subtracts risk in Palantir’s case.
TATA (Total Accruals to Total Assets) ≈ -0.11 – Palantir’s accrual ratio is negative because cash flow exceeded accounting earnings. Beneish heavily weights this (coefficient ~4.679) since high positive accruals often signal potential earnings manipulation. Palantir’s negative accrual (driven by heavy non-cash expenses like SBC) actually reduces its M-Score (a positive for honesty). Essentially, Palantir’s earnings are backed by cash and then some – the opposite of what we’d fear in manipulation.
Combining these, the M-Score of -2.60 indicates low likelihood of earnings manipulation. For context, companies with scores > -2.22 are considered at risk of manipulation (the model famously identified Enron with an M-Score around -1.89 in hindsight). Palantir is well below that risk zone. It is worth monitoring DSRI (accounts receivable) and SGI (continued rapid growth) going forward. But absent other red flags, those are not alarming by themselves. The Beneish analysis overall gives Palantir a clean bill of health in 2024 from an accounting red flags perspective.
Altman Z-Score (Bankruptcy/Financial Distress Risk): Palantir’s Altman Z-Score for 2024 is extremely high – by any standard, Palantir is in the “Safe” zone. Using the original Altman formula for public manufacturers (which is a bit imperfect for a software firm, but illustrative), Palantir’s Z is in the tens if not higher. Even using a variant for non-manufacturers (which drops the sales/asset term), the result is sky-high. This is driven by:
High working capital: Palantir has $5.93B in current assets vs $0.996B in current liabilities, so working capital/total assets is very large. This contributes strongly to Z (WC/TA ~0.78).
Retained earnings: Palantir does have an accumulated deficit of $5.187B due to prior losses, which normally would drag Z-Score down. But in Palantir’s case, other factors swamp this. (For reference, RE/TA ~ -0.82, which alone would be a negative factor – it shows the company burned a lot of equity historically. However, now that they are profitable, that deficit will start to shrink in coming years).
EBIT: Using 2024 EBIT of $310.4M, EBIT/TA ≈ 4.9%. This is a modest contributor.
Market Value of Equity vs Liabilities: This is where Palantir shines. At year-end 2024, Palantir’s market cap was roughly $191 billion (2.53B shares × ~$75.63 share price). Total liabilities were only $1.246B. The ratio of MVE/TL is astronomically high (~153x). Even multiplied by Altman’s weight of 0.6, this adds dozens of points to the Z-score. This reflects investor confidence and also the lack of debt.
Sales/Assets: $2.865B / $6.341B ≈ 0.45, which is typical for a software firm (assets are mostly cash from financing, so sales-to-assets isn’t very high). This factor isn’t a big driver either way.
In Altman’s classic zones, Z > 2.99 = “Safe” (low default risk). Palantir’s Z is far above 2.99 by any reasonable calculation. Even if we consider the accumulated deficit as a slight negative, the enormous market cap and cash position make financial distress almost inconceivable in the near term. The only caveat: the Z-Score’s reliance on market value means it’s high partly because the stock was high. If Palantir’s stock were to plummet, that component would change. But they’d still have billions in cash and no debt, so even a much lower market cap likely keeps them out of danger. The upshot is that Palantir has zero bankruptcy risk for the foreseeable future, a point corroborated by its ability to generate cash and its $500M undrawn credit line. There are no debt covenants or liquidity crunches in sight. (Altman Z may be overkill here, but it serves to confirm the obvious: this is not a distressed company.)
Piotroski F-Score (Financial Strength): Piotroski’s F-Score is a nine-criterion score assessing profitability, leverage/liquidity, and operating efficiency improvements. Palantir scores 5 out of 9 for 2024, which is moderate – neither strong nor weak. Let’s go through each of the 9 factors (scoring 1 if true):
Positive Net Income? – Yes. Palantir had +$467.9M net income in 2024 (first time positive full-year GAAP profit). F-score: 1.
Positive Operating Cash Flow? – Yes. $1.153B CFO positive. F-score: 1.
Higher ROA Year-over-Year? – Yes. Return on assets (ROA) improved dramatically from 2023 to 2024 (in 2023, NI $217M on assets $4.52B = ~4.8%; in 2024, NI $468M on assets $6.34B = ~7.4%). Improvement → F-score: 1.
Cash Flow > Net Income? – Yes. CFO ($1.15B) > NI ($467.9M). This indicates earnings are backed by cash (no income puffery). F-score: 1.
Lower Leverage (debt) vs last year? – N/A. Palantir had no debt in both 2023 and 2024, so there was no debt to reduce. Piotroski would not award a point because leverage ratio didn’t improve (it stayed at zero). So F-score: 0 (though in fairness, zero debt is already ideal).
Higher Current Ratio vs last year? – Yes. Current ratio improved: 2024 current assets $5.934B vs current liab $0.996B = 5.96x, up from 2023’s 5.55x (4.139B/0.746B). F-score: 1.
No new shares issued in the year? – No. Unfortunately, Palantir did issue more shares (shares increased from ~2.20B to 2.339B. Even though it did a small buyback, net share count rose ~6%. Piotroski penalizes this since issuing equity can signal financial weakness. F-score: 0.
Higher Gross Margin vs last year? – No. Gross margin was 80% in 2024 vs 81% in 2023. A slight decline, so no point.
Higher Asset Turnover (sales/assets) vs last year? – No. Asset turnover fell slightly (sales up 29% but total assets up ~40% due to cash buildup). 2024 sales/avg assets ~0.50 vs prior ~0.55 (approx). No point.
Summing up: 1+1+1+1+0+1+0+0+0 = 5. A score of 5 is average. It reflects that Palantir is now profitable and generating cash (good), but also that it continues to dilute equity and didn’t improve margins in 2024 (mixed). Typically, an F-score of 8-9 is considered very strong (often deep value stocks improving operations), while 0-2 is very weak. Palantir’s 5 puts it roughly in the middle – not a classic undervalued turnaround by Piotroski’s measure, but not a financially frail firm either. It’s actually common for growth tech companies to score around 4-5 when they start turning profitable: they tick the profitability boxes, but fail the share dilution criterion and possibly margins.
The main deduction in F-score for Palantir is share issuance. If Palantir’s SBC-driven dilution continues, it will keep missing that criterion. Conversely, if Palantir can sustain profitability and perhaps even start reducing shares (via more buybacks), its F-score would rise. Another area for improvement is gross margin – if they manage to expand margins (say through price increases or efficiency), that would add a point.
In summary, the forensic models collectively reassure that Palantir’s financial statements are likely trustworthy and the company is financially solid:
M-Score: No signs of earnings manipulation (score indicates a low risk profile, consistent with clean accounting).
Z-Score: Extremely solvent and far from distress.
F-Score: Decent financial strength, with the caveat of ongoing equity dilution and only slight efficiency gains so far.
Profitability: Gross & Operating Margins
Palantir boasts Gross Margins ~80% in 2024, which is among the highest in its peer set. For instance, Snowflake’s gross margin was about 67% in its FY2025 (ended Jan 2025). Snowflake’s lower GM reflects heavy cloud infrastructure costs for its data warehousing service. Splunk, transitioning to cloud, reported ~72-78% gross margin (not explicitly given in their release, but historically ~75% – likely in that range for FY2024). Alteryx, which sells on-premise analytics software, had a GAAP gross margin of 86% for 2023, topping Palantir – Alteryx benefits from a higher mix of pure software license revenue and less services. SAP, a massive enterprise software firm, had a gross margin around ~72% (IFRS) in 2024 (calculated from €gross profit/€revenues). Cognizant, being an IT services outsourcer, is an outlier with gross margins in the ~30-35% range (much lower, since it has a high cost of revenue in paying armies of consultants). In sum, Palantir’s ~80% gross margin is in line with top-tier software peers – not a red flag at all. It indicates strong pricing power and a product-centric revenue mix.
On Operating Margin, Palantir turned a GAAP operating margin of 10.8% in 2024 (after -7% in 2022 and +5% in 2023). This is a notable achievement among high-growth tech firms:
Snowflake is still deeply in the red at the operating level: it posted a -40% GAAP operating margin in FY2025 (operating loss $1.456B on $3.626B revenue). Even on a non-GAAP basis (excluding stock comp), Snowflake was around break-even to slightly positive. This underscores Palantir’s comparatively disciplined spending or higher revenue per cost.
Splunk in FY2024 reached +5.7% GAAP operating margin, similar to Palantir’s prior year. Splunk, however, had many years of large losses before and benefitted from cost cuts and a shift to cloud subscription model paying off. Palantir at 10.8% is roughly double Splunk’s margin, showing it has pulled ahead on profitability for now.
Alteryx is still negative: -17% operating margin in 2023 (though that’s a big improvement from -35% in 2022). They aim to break even in 2024 or 2025, but aren’t there yet GAAP-wise.
Cognizant routinely has op margins ~14-15% (13.9% GAAP in 2023). But that’s a services business with much lower gross margin – hitting mid-teens is expected for a consulting firm. Palantir at ~11% and rising could approach Cognizant’s level soon, which is impressive for a product company that simultaneously grows ~30% (Cognizant is growing low single-digits at best).
SAP had a 13.6% operating margin (IFRS) in 2024, down from ~17% the year before, due to restructuring and cloud transition costs. Historically SAP had 30%+ margins in the on-prem era; now it’s investing heavily. Palantir isn’t near SAP’s historical profitability, but against current SAP, Palantir is surprisingly not far off. Non-IFRS, SAP’s op margin was ~26% (excluding certain charges) – still higher than Palantir, showing the profitability potential of a mature software firm.
In summary, Palantir’s margins are excellent relative to peers. It is the only one of the high-growth cohort (Palantir, Snowflake, Alteryx) that is GAAP profitable. This suggests less risk of desperate cost capitalization or revenue tricks – Palantir doesn’t need to cook books to show a profit, it’s already there. If anything, peers like Snowflake have more “risk” in terms of needing to justify valuations while in loss, though there’s no evidence they manipulate either (Snowflake’s losses are clearly driven by huge SBC and investment in growth).
R&D Intensity and Innovation
Palantir is often considered a tech innovator with heavy R&D – in 2024 it spent $508M on R&D (17.7% of revenue). How does this compare?
Snowflake invests heavily in R&D as well; while their financials combine R&D with tech infrastructure in some cases, Snowflake’s R&D expense was roughly $704M in FY2024 (approx 19% of revenue) if one extracts from their operating expense breakdown. (Snowflake’s total OpEx was $3.868B including S&M ~$1.5B, R&D perhaps ~$800M, G&A ~$300M, and SBC allocated across these).
Splunk spent $828M on R&D in FY2023 (22% of $3.65B rev) and likely a similar ~$900M in FY2024 (~21% of $4.22B rev). As a mature company, Splunk still invests a lot in product (cybersecurity, observability features).
Alteryx spent $216M on R&D in 2023 (~22% of $970M rev). They actually reduced R&D from $253M in 2022 as part of cost-cutting (which could be a concern for their innovation pipeline, but helped margin).
Cognizant R&D is negligible – perhaps 2-3% of revenue at most (they are primarily a services provider, not selling software products; their “R&D” might be internal tools development).
SAP spends about 16% of revenue on R&D (€4.66B on €30.9B rev in 2024).
IBM (overall) spends about 7-8% on R&D, though for IBM’s software/cloud divisions it might be higher.
Palantir’s 18% is in line with enterprise software norms (~15-20%). It’s a healthy sign that Palantir did not drastically slash R&D to achieve profitability. In fact, R&D grew 26% YoY. This is important because cutting R&D can momentarily boost profits at the expense of future product strength (and can be a subtle red flag if done excessively). Palantir did not go that route – it balanced growth and margin. By contrast, Alteryx cutting R&D 15% in 2023 to stem losses could pose longer-term issues (forensic analysis isn’t directly about that, but it’s a strategic concern).
From a risk perspective, Palantir’s continued high R&D means less risk of understating expenses – they are clearly willing to expense big ongoing investments. It also bodes well for staying ahead technologically (important as competition like Snowflake encroaches on AI/analytics).
Stock-Based Compensation and Dilution Trends
This is where Palantir raises eyebrows relative to peers. Palantir has been notorious for its heavy use of stock-based compensation. Let’s quantify and compare:
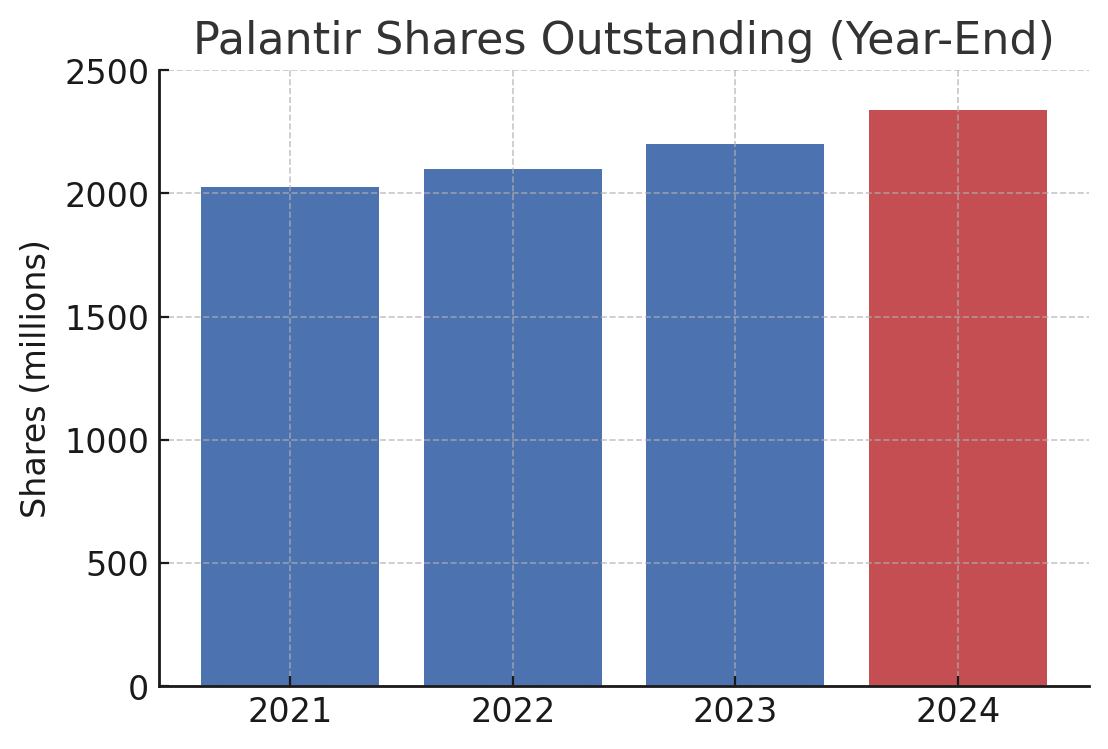
Palantir: SBC expense in 2024 was $693M, following $476M in 2023 and $565M in 2022. Cumulatively from 2020–2024, Palantir has recognized well over $2 billion in SBC. As a % of revenue, 2024 SBC was 24% of sales (693/2866). This is extremely high by traditional standards – it means nearly a quarter of Palantir’s revenue was effectively paid out in equity to employees. The dilution effect is evident: shares outstanding rose ~6% in 2024 (net of a small buyback). Over a longer horizon, from 2021’s direct listing to end of 2024, Palantir’s share count ballooned from ~2.03B to ~2.34B – a 15% increase in three years. The chart below illustrates this upward trend in Palantir’s outstanding shares:
Palantir’s total shares outstanding (year-end 2021–2024) rose ~15%, reflecting stock-based awards and option exercises. 2024 saw ~139 million net new shares issued despite a modest buyback, highlighting ongoing dilution risk.
While stock-based comp aligns employees with the company and conserves cash, the scale at Palantir is a red flag for investors because it continually dilutes their ownership. The company acknowledges this and in 2023 authorized a $1B repurchase program to offset some dilution. They only used $64M of that in 2024, barely denting issuance. It’s a bit of a double-edged sword: SBC helped Palantir fund operations during years of negative cash flow (essentially paying staff in stock), and now that cash flow is robust, they could dial it down. But 2024 saw a 45% jump in SBC expense (perhaps due to new performance RSUs and higher stock price resulting in more tax withholding via share settlements). This is a key risk factor because if Palantir’s stock stays high, employees may continue to cash out significant shares, and Palantir may need to issue more to keep talent.
Snowflake: Another heavy SBC user. In calendar 2024 (Snowflake’s FY2025), SBC was roughly $1.3B (this is an estimate – in FY2024 it was $1.168B, which was 42% of $2.8B revenue!). Snowflake’s dilution has also been significant, though mitigated by its smaller share count. Weighted avg shares were 333M in FY2025 up from 298M in FY2024 (~12% increase). Snowflake and Palantir are often cited together for high SBC. The difference is Palantir’s shares are in the billions, so each % of dilution is many more shares, and Palantir’s SBC as % of revenue, while very high, actually dropped to ~24% in 2023 before rising to 24% in 2024 – Snowflake’s is higher in percentage terms. Both are essentially using stock to fuel growth, but Palantir’s overall shareholder base has been diluted more since listing (partly because Palantir started with an enormous options/RSU overhang from pre-IPO – e.g., early employees and founders had a lot of awards that vested upon the direct listing event, causing a huge spike in 2020–2021 share count).
Splunk: Historically Splunk had high SBC too (in recent years ~$600-800M/year). However, Splunk also did significant share buybacks funded by debt in the late 2010s to offset dilution. By FY2024, Splunk’s SBC was lower relative to revenue than Palantir’s. Splunk had about 165 million shares in 2024, up only modestly from 158 million in 2023 (they slowed dilution as they hit profitability). So Splunk’s dilution is much less of an issue now – they fixed that trajectory, which is partly why their GAAP profitability per share improved.
Alteryx: SBC in 2023 was ~$150M (we infer this since non-GAAP op income was $142M versus GAAP op loss -$165M, the $307M difference is mostly SBC). That’s ~15% of revenue, and share count went from 69M to ~77M (12% dilution) over 2023. Alteryx announced a restructuring and did layoffs (reducing headcount by 21%, which likely slowed future SBC grants. Alteryx’s stock price also fell in 2022–2023, so employee options/RSUs were not as wildly valuable - limiting dilution a bit.
Cognizant: Being an IT services firm, Cognizant uses relatively little SBC and actually buys back shares regularly. In 2023, Cognizant’s share count decreased as it repurchased stock. So dilution is not a concern there – if anything, there’s accretion.
SAP and IBM: These firms have mild dilution. SAP has a shareholder-friendly dividend and does some buybacks; any SBC (mostly for execs) is minimal relative to their €130B market cap. IBM’s share count has actually decreased over the years due to buybacks (until recently). Neither relies on equity comp for rank-and-file to the extent Silicon Valley companies do.
Bottom line: Palantir and Snowflake stand out for dilution risk. In a forensic analysis, this is important because excessive SBC can be used to mask true labor costs and inflate margins (since GAAP records SBC as an expense, it does hit earnings, but some non-GAAP metrics exclude it, which management might emphasize). Palantir does report adjusted income excluding SBC. For example, Palantir claimed $548M of adjusted income (24% margin) in 2024, excluding stock comp and related employer taxes – a very rosy figure compared to its 11% GAAP margin. Relying on adjusted metrics can be a red flag if the adjustments are large. In Palantir’s case, the adjustment (mostly SBC) is huge. The risk is that if investors focus on those adjusted profits, they might underestimate how much value is being transferred to employees via stock. Over time, if Palantir cannot grow out of this high SBC as a percentage of revenue, shareholders may never fully reap the benefits of revenue growth (since a chunk is continually given away). However, there is a positive sign: Palantir’s SBC as % of revenue did drop from ~39% in 2021 to ~21% in 2023, before ticking up to 24% in 2024. If 2024’s increase was due to a one-time performance grant or catch-up, we might see it stabilize or decline again. This will be crucial to watch.
CONTINUED IN ATTACHMENT INCLUDING ENTIRE POST