VIK Under the Lens: Forensic Risk Signals Amid Post-IPO Momentum
Dissecting Viking Holdings’ Clean-Up Accounting, Cash Flow Discrepancies, and Event-Driven Trade Structures Across Equity, Credit, and Options

Executive Summary
Viking Holdings Ltd (NYSE: VIK) exhibits significant financial anomalies and improvements in its FY2024 SEC Form 20-F. Core operations rebounded strongly post-pandemic – revenue grew ~13% in 2024 with operating income up 32% year-on-year, yielding a 20.2% operating margin (vs 17.3% in 2023). However, below-the-line factors obscured performance, including huge non-cash derivative losses tied to pre-IPO financing and prior-period accounting revisions. These drove a $1.85 billion net loss in 2023 despite robust operating profits. In 2024, the derivative was eliminated upon conversion of Series C preferred shares at IPO, swinging net income to +$153 million. Even so, equity remained negative at year-end 2024 (–$219 million) due to cumulative losses. We flag the following key findings:
Accounting Complexity from Private Placement Derivative unwind
Cumulative net losses have erased tangible equity base (–$219M at YE 2024)
Material weaknesses in internal controls remain unresolved
Altman Z-Score of ~1.0 implies structural credit fragility
Strong cash conversion (+$1.3B CFO vs $153M NI) masks accrual distortions
SignalVest View: Viking represents a post-IPO momentum story with improved earnings quality, but materially elevated balance sheet risk. The business is fundamentally cash-generative; however, legacy financing distortions, related-party complexity, and aggressive depreciation adjustments require forensic surveillance.
Earnings Quality Red Flags: Viking’s GAAP earnings were distorted by fair-value remeasurements of a “Private Placement” derivative. This instrument generated an $808.5 million gain in 2022, then a $(2.0) billion loss in 2023, and $(364) million loss in 2024. These massive swings point to volatile financial engineering – indeed, the derivative’s fair value ballooned with Viking’s rising share price pre-IPO and was derecognized upon conversion to equity (adding $4.4 billion to share premium). Excluding these one-offs, Viking’s adjusted earnings were positive. Additionally, prior financials were quietly revised: the 20-F discloses an ~$80 million increase in 2023 assets and a reduction of interest expense ($10.9 M in 2023) due to capitalizing interest on ship construction. This correction improved 2022–2023 net income by ~$24.7 million total, indicating an earlier misapplication of accounting policy.
Cash Flow vs Earnings Divergence: We observed significant accrual anomalies. In 2023, Viking reported a $(1.85) billion net loss but generated $1.37 billion in operating cash flow. Conversely, 2022’s $415 million net profit produced only $373 million CFO, as that profit included non-cash gains. 2024’s CFO exceeded net income by >$1.9 billion. These gaps (illustrated in Figure 1 below) reflect large non-cash charges/gains flowing through earnings. Notably, deferred revenue (customer deposits) grew by $575 million in 2024, bolstering cash flow. Such persistent CFO–NI mismatches warrant scrutiny – while non-cash charges (derivative losses, impairments) explain the 2023–24 deltas, investors should monitor earnings quality going forward now that those items are gone.
Figure 1: Viking’s operating vs net profitability. Operating margins improved steadily from 2022–2024, but net margins swung wildly due to one-time financial items. In 2023, Viking earned a 17% operating margin yet lost 39% net margin (red), reflecting a $2 billion derivative loss. Net margin rebounded to 2.9% in 2024 after the derivative was converted to equity, narrowing the gap with the operating margin.
Trend Inconsistencies: Excluding one-offs, revenue and cost trends appear reasonable. Revenue surged +48% in 2023 (pandemic recovery) then +13% in 2024 to $5.33 billion. Gross margin expanded from 32% (2022) to 42% (2024) as capacity utilization improved and pricing held. Operating expenses like Selling, General & Admin (SG&A) grew ~15% in 2023 and 12% in 2024, slightly trailing revenue, indicating scalability rather than expense deferral. One subtle inconsistency is depreciation: despite fleet growth, depreciation/amortization expense fell 9% in 2023 (then rose modestly in 2024). This suggests Viking extended asset useful lives or residual values in 2023, boosting earnings – a common earnings management lever. Indeed, auditors flagged “Fleet Accounting – Useful Lives and Residual Values” as a Critical Audit Matter, noting high subjectivity in management’s estimates that significantly affect depreciation expense. This CAM underscores that small assumption changes can materially alter earnings. Overall, aside from depreciation policy tweaks, quarterly revenue recognition appears consistent (no evidence of quarter-end bill spikes), and no sudden margin “hockey sticks” beyond what the industry rebound explains.
Management Disclosures & Footnotes: Viking’s 20-F footnotes are generally transparent about these anomalies. The Private Placement financing (with TPG Capital) is detailed in Note 20: all Series C preferred shares converted 1:1 to common at IPO, with the derivative’s fair value settled based on the $24 IPO price. This removed ~$4.0 billion of liabilities from the balance sheet (improving equity accordingly). Management’s discussion emphasizes “adjusted” metrics stripping out the derivative and one-offs – e.g. FY2024 adjusted EPS was $1.86 vs $0.36 GAAP, highlighting the gap. We note Viking revised its prior-year statements (see Note 2) to correct interest capitalization for vessels, an ambiguous admission of weakness in the 2023 close process. The filing tone is otherwise factual, albeit upbeat on demand (forward bookings), while downplaying risks of its levered capital structure. The company does disclose sizable related-party balances – e.g. $51.8 million payable to related parties at 2024 year-end – primarily due to due to the founder/Chairman (and entities he controls) fronting certain expenses and intercompany loans. These appear routine (operational funding) rather than self-dealing, but warrant monitoring. No major related-party revenue transactions were noted. Viking did not report any restatements, only the aforementioned revisions, and there’s no explicit mention of accounting policy changes besides new IFRS adoption and the interest capitalization fix.
Off-Balance-Sheet & Liability Issues: We did not find material off-balance-sheet obligations beyond standard purchase commitments. Viking has already capitalized its lease obligations under IFRS 16, carrying $263 million in right-of-use assets and corresponding lease liabilities ($236.5 million total) on the 2024 balance sheet. The dramatic reduction in long-term liabilities from $9.48 billion (2023) to $5.12 billion (2024) is explained by the Series C conversion (removal of ~$4.0 billion Private Placement liability/derivative). Interest-bearing debt remains high at ~$4.87 billion (excluding leases) – Viking carries ocean vessel secured notes (9.125% coupon) and bank loans that cost $380 million in interest in 2024. We note that deferred revenue (customer deposits) of $4.06 billion now constitutes the largest current liability. This represents prepaid travel bookings – essentially an interest-free loan from customers, but if cancellations spike or bookings falter, this liability could unwind and squeeze liquidity.
Audit & Controls: Viking received an unqualified audit opinion for FY2024 (under PCAOB standards, EY AS is the auditor) with no going-concern warnings. The auditors did not issue a qualified opinion or emphasis-of-matter paragraph. However, material weaknesses in internal control were disclosed by management. Specifically, Viking identified two material weaknesses in its 2022–2023 controls: (1) IT user access & change-management deficiencies, and (2) inadequate controls over financial close and non-routine transactions (e.g. journal review, segregation of duties). These weaknesses could allow misstatements to go undetected. Management asserts that despite these issues, the financials are fairly presented, supported by additional audit procedures. A remediation plan is underway, including tighter IT role reviews, new reconciliation tools, and training. Investors should be aware that until remediated (likely by late 2025), reporting risk remains elevated. Encouragingly, the control issues appear to relate to process and documentation (partly evidenced by the need to revise interest capitalization), rather than intentional misstatement.
Forensic Risk Model Scores: We applied three forensic models to Viking’s financials:
Beneish M-Score: Viking’s M-Score is approximately 3.58, well below the (–2.22) threshold that signals earnings manipulation risk (more negative is better). This low score is driven by a huge accrual reversal (large non-cash losses made CFO >> NI) and improving asset quality. For example, receivables fell to 4.5% of sales in 2024 from 7.3% in 2023, indicating no sign of aggressive revenue recognition. The only Beneish flag is a Depreciation Index > 1.0 – depreciation rate decreased, consistent with lengthened ship lives in 2023. While the M-score does not suggest broad manipulation, the depreciation change warrants vigilance (it flatters earnings, as auditors noted). Overall, no systematic earnings manipulation is evident; the swings appear driven by transparent one-time items rather than subtle cooking of core numbers.
Altman Z-Score: By contrast, Viking’s Altman Z-Score is ~1.0, firmly in the “distress” zone (<<1.8). This reflects its leveraged balance sheet and negative retained earnings. Key Z components are weak: working capital is –$2.0 billion (huge customer deposits), and the accumulated deficit is $5.3 billion. Even with a ~$20 billion market cap, the equity-to-debt ratio is low (market value of equity ~1.9× total liabilities). A Z-score of 1.0 suggests elevated bankruptcy risk for a manufacturing firm; for Viking (a service-oriented cruise operator), it signals that solvency is heavily dependent on continued cash generation and access to financing. In short, Viking’s risk profile is closer to a distressed issuer than its equity valuation would imply – a concern if business conditions deteriorate.
Piotroski F-Score: Viking scores 7 out of 9, indicating improving financial strength. It earned points for positive net income in 2024, positive cash flow, an increase in ROA, CFO > NI, lower leverage, and higher liquidity. Gross margin also rose year-over-year. The only areas lacking were asset turnover (slightly declined as assets grew faster than revenue) and equity dilution (shares outstanding increased with the IPO). A high F-Score suggests Viking’s financial performance and efficiency are trending positively. This aligns with the narrative of recovery: profitability is back, and the balance sheet was de-risked by converting debt to equity. However, the F-Score doesn’t capture the remaining leverage risk or the one-time nature of some improvements (e.g. derivative gone). It simply reinforces that 2024 was a turning point in fundamentals.
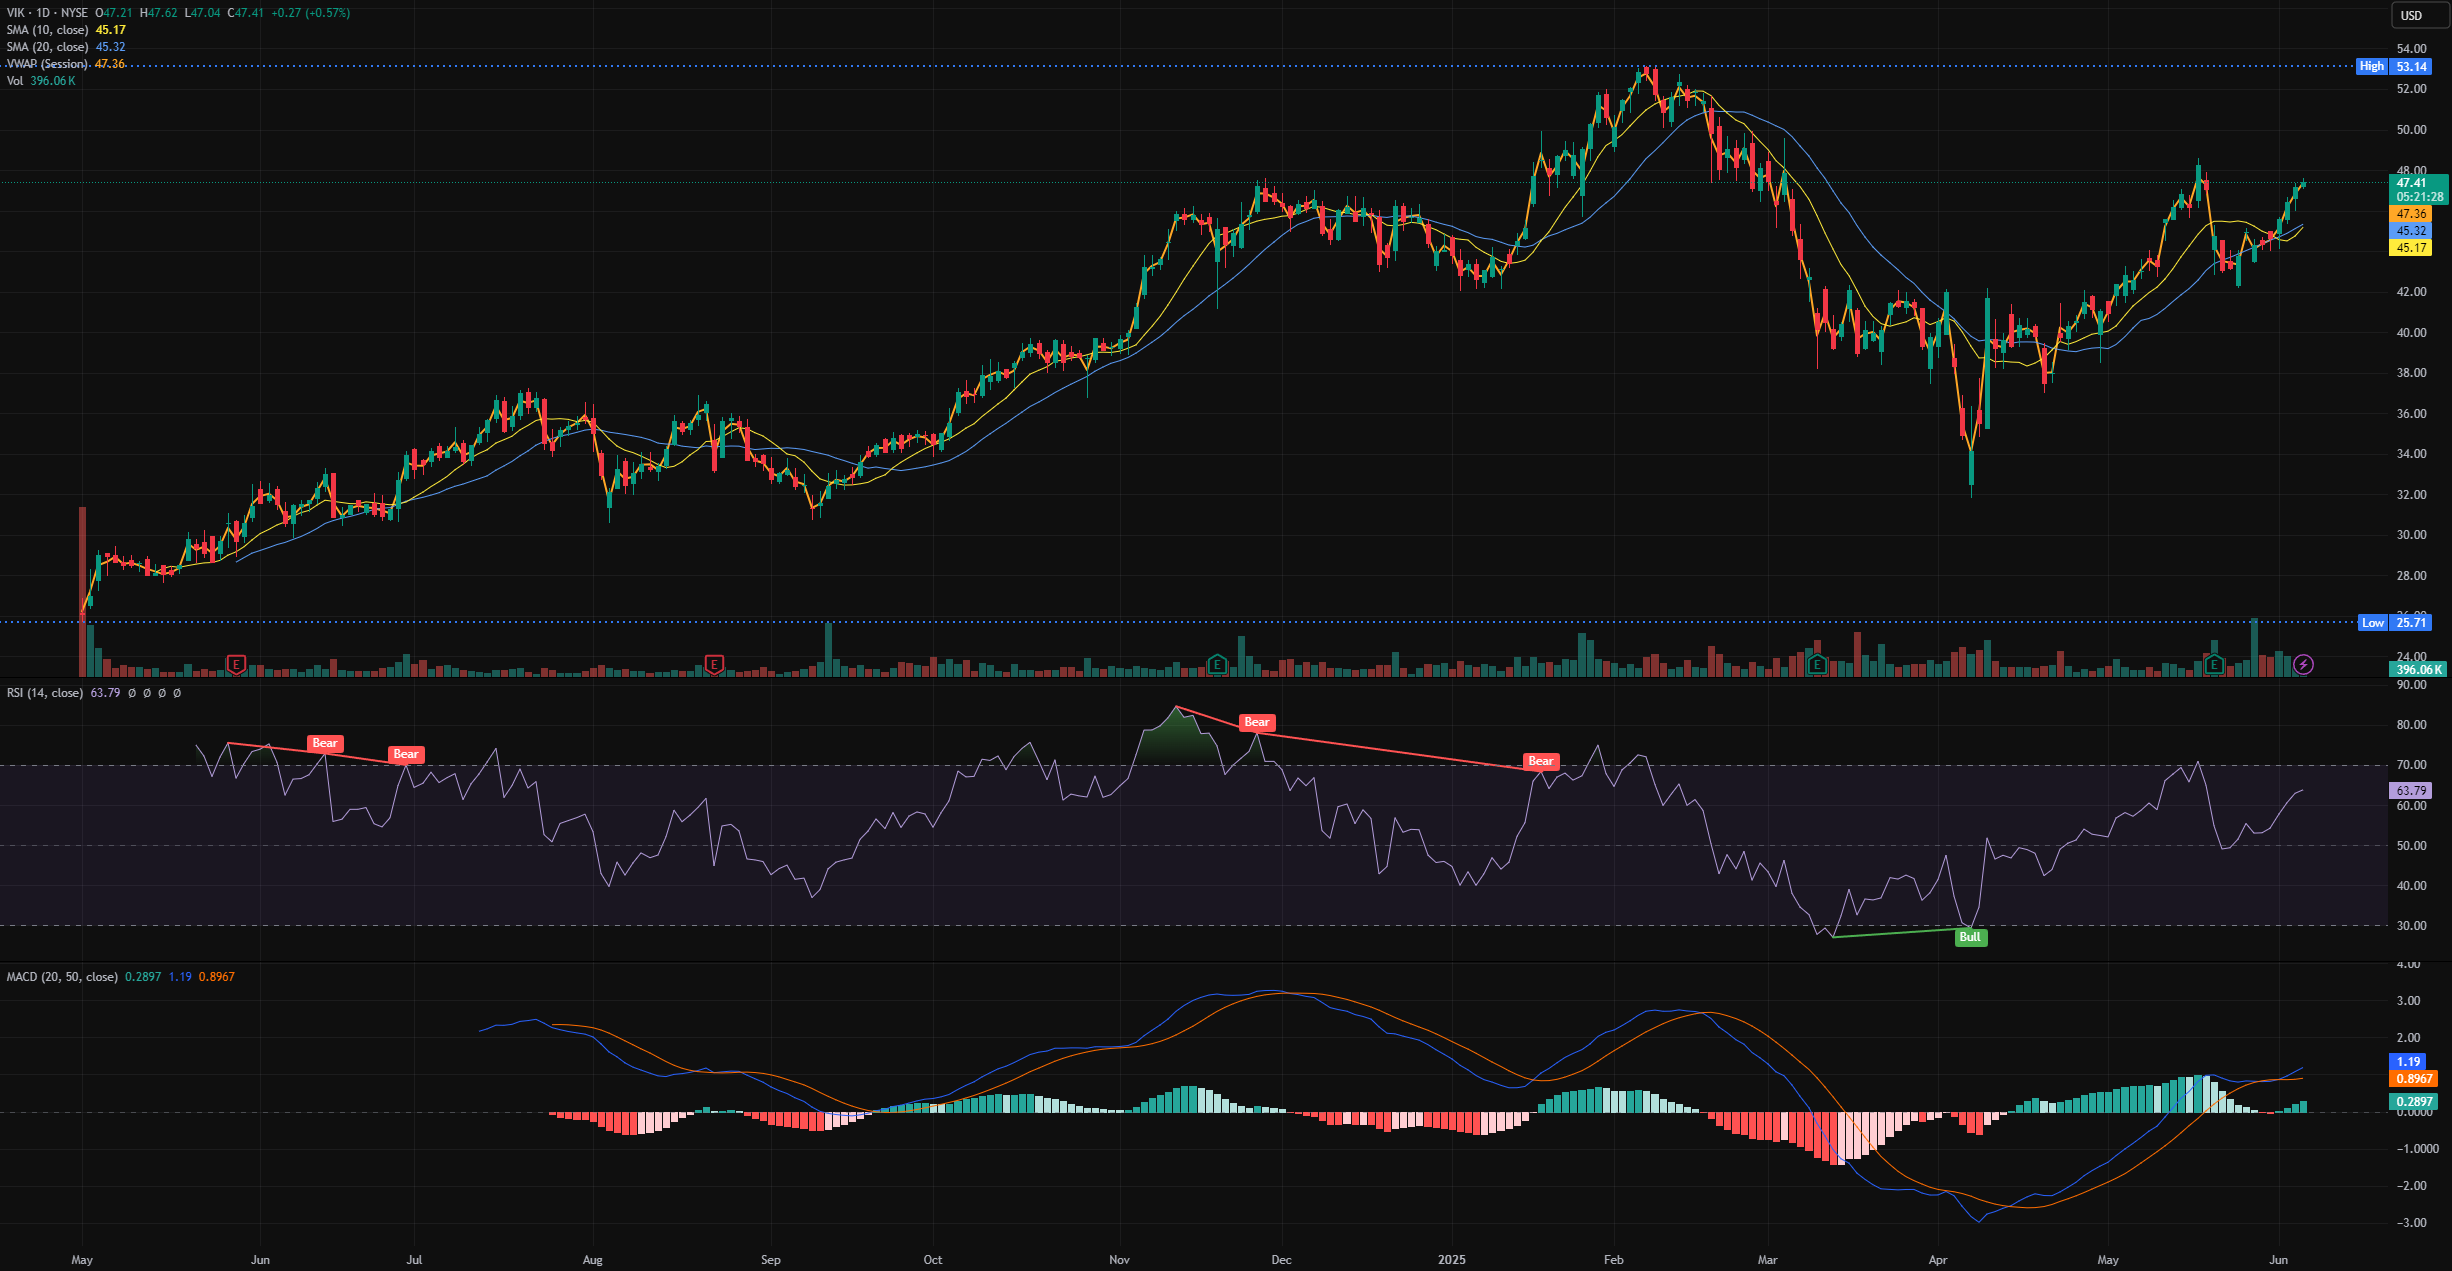
Insider & Market Signals: We found no explicit insider-trading red flags in the 20-F (insiders were under lock-up through late 2024). However, in May 2025 (after the filing period), pre-IPO shareholders initiated a secondary offering, suggesting that at least one major insider (potentially TPG or the founder) is trimming their stake. This could indicate confidence that the market can absorb shares at current valuations, or simply an exit strategy. We also note Viking’s stock has been volatile since its mid-2024 IPO (52-week high $53.14, low $29.83). Unusual trading volume spikes have corresponded with news such as earnings releases – e.g. Q4 2024 results swung the stock as GAAP profit returned and the company introduced generous adjusted metrics. No suspicious pattern of insider stock sales ahead of results is apparent so far, but this being Viking’s first year public, data is limited. On the vendor financing front, Viking does not appear to engage in aggressive practices like financing customer purchases or channel stuffing – its product is cruise tickets (paid in advance). If anything, the customers finance Viking via deposits. Trade payables have not ballooned abnormally (accounts payable actually decreased slightly to $236 million in 2024), so there’s no evidence the company is delaying payments to suppliers to burnish cash flows. Related-party loans (around $14 million) are minor. In sum, market and insider signals are mixed: the stock’s strong post-IPO performance reflects optimism in the recovery, yet insiders are beginning to reduce exposure, and the company’s high debt means credit markets remain cautious.
Event-Driven Outlook & Trade Ideas (3–6 month horizon): We recommend a cautiously opportunistic strategy. Viking’s narrative now shifts from cleanup to execution, creating both long and short trade setups:
Equity – Long Bias on Execution, with Downside Hedge: With the derivative overhang gone, Viking’s GAAP earnings will more fully reflect its booming core business in upcoming quarters. Street estimates foresee ~$1 billion in 2025 earnings, implying a forward P/E ~20 – reasonable if double-digit growth continues. A catalyst ahead is Q2 2025 results (Aug 2025), where Viking could surprise on net yield or announce new ship deployments. Going long VIK common stock into the next earnings release is attractive, provided one hedges the downside. We suggest pairing a long equity position with protective puts (e.g. 3-month ATM puts) given macro risks (recession or fuel cost spikes could hurt bookings). This structure lets investors participate in further post-COVID recovery (and possible index inclusion flows) while limiting tail risk. The put hedge is prudent until internal control issues are fully resolved and leverage is reduced.
Options – Capitalize on Volatility Skew: Viking’s unique accounting story has likely kept implied volatility elevated. As the market gains clarity (with cleaner earnings now), implied vol may compress. An earnings “vol crush” trade is to sell volatility around results once guidance is well-telegraphed. For instance, one could sell straddles or strangles after a pre-announcement or use a call spread collar strategy (sell calls to fund puts) to earn premium while positioning for moderate upside. Alternatively, if one expects overly bullish sentiment into Q3 (ignoring the heavy debt), buying puts or put spreads after a price rally could pay off if the stock reverses on any misstep. We note that upside calls could be attractive if Viking’s booking momentum accelerates – a call option limits risk from any shock (COVID variant, etc.). Focus on options spanning the next two earnings dates for maximum catalyst exposure.
Credit – Long Yield, Short Equity Hedge: Viking’s bonds trade in high-yield territory (the 9.125% 2031 notes). Given the improvement in EBITDA and the $2.49 billion cash on hand, credit risk in the near term is moderated. We recommend going long Viking’s unsecured notes to capture ~9–10% yield, paired with a short position in VIK equity as a hedge. This capital structure arbitrage bets that credit spreads will tighten (as leverage falls with earnings and possible debt paydown), while the richly valued equity could lag if any growth hiccup. The short equity hedge protects against downside scenarios where both stock and bond would fall (e.g. demand shock). Conversely, in a bullish scenario, the bonds should hold value (possibly get called/refinanced), and the short equity can be managed with a stop-loss or converted to a put option for defined risk. Additionally, CDS on Viking (if liquid) could be a play for those seeking downside protection. Although Viking’s improving cash flow makes outright default unlikely, high leverage means any unexpected shutdown (e.g. pandemic recurrence) would severely stress the company.
Special Situations – Structured Products: No clear mispricings in structured securities are evident now that the pref shares and warrants have been converted or exercised. However, Viking’s rich equity valuation versus poor Altman Z-score invites a bespoke structure: for example, a 6-month capital-protected note that pays a coupon tied to Viking’s stock performance could allow upside exposure with downside protection, exploiting the stock’s volatility. Investors might also consider contingent convertibles if Viking seeks to refinance debt, being ready to participate in any new convertible bond issuance (which could be offered at attractive terms given the high stock price). Absent such events, we suggest monitoring insider lockup expirations and secondary offerings. A sudden share offering by insiders (as in May 2025) can pressure the stock – a short-term short trade or put purchase ahead of these events can be profitable. Likewise, any credit rating upgrade or index inclusion (if Viking’s financials continue to strengthen) could tighten credit spreads or boost the stock, a catalyst to be long for.
In conclusion, Viking Holdings’ 20-F reveals a company at an inflection point. Forensically, most red flags stem from legacy financing complexity and accounting clean-up, not core business manipulation. The business itself is cash-generative and growing, but highly levered. Hedge funds and sophisticated investors should remain vigilant on accounting quality (e.g. depreciation assumptions, internal controls) and capital deployment (watch for debt reduction or new equity outflows). The recommended strategies seek to balance Viking’s upside potential from operational momentum with protection against its frailties (leverage and accounting risk), positioning for the next 3–6 months of event-driven developments.